Examples using PoliSciPy
Below is a gallery of images showing maps created using the PoliSciPy package.
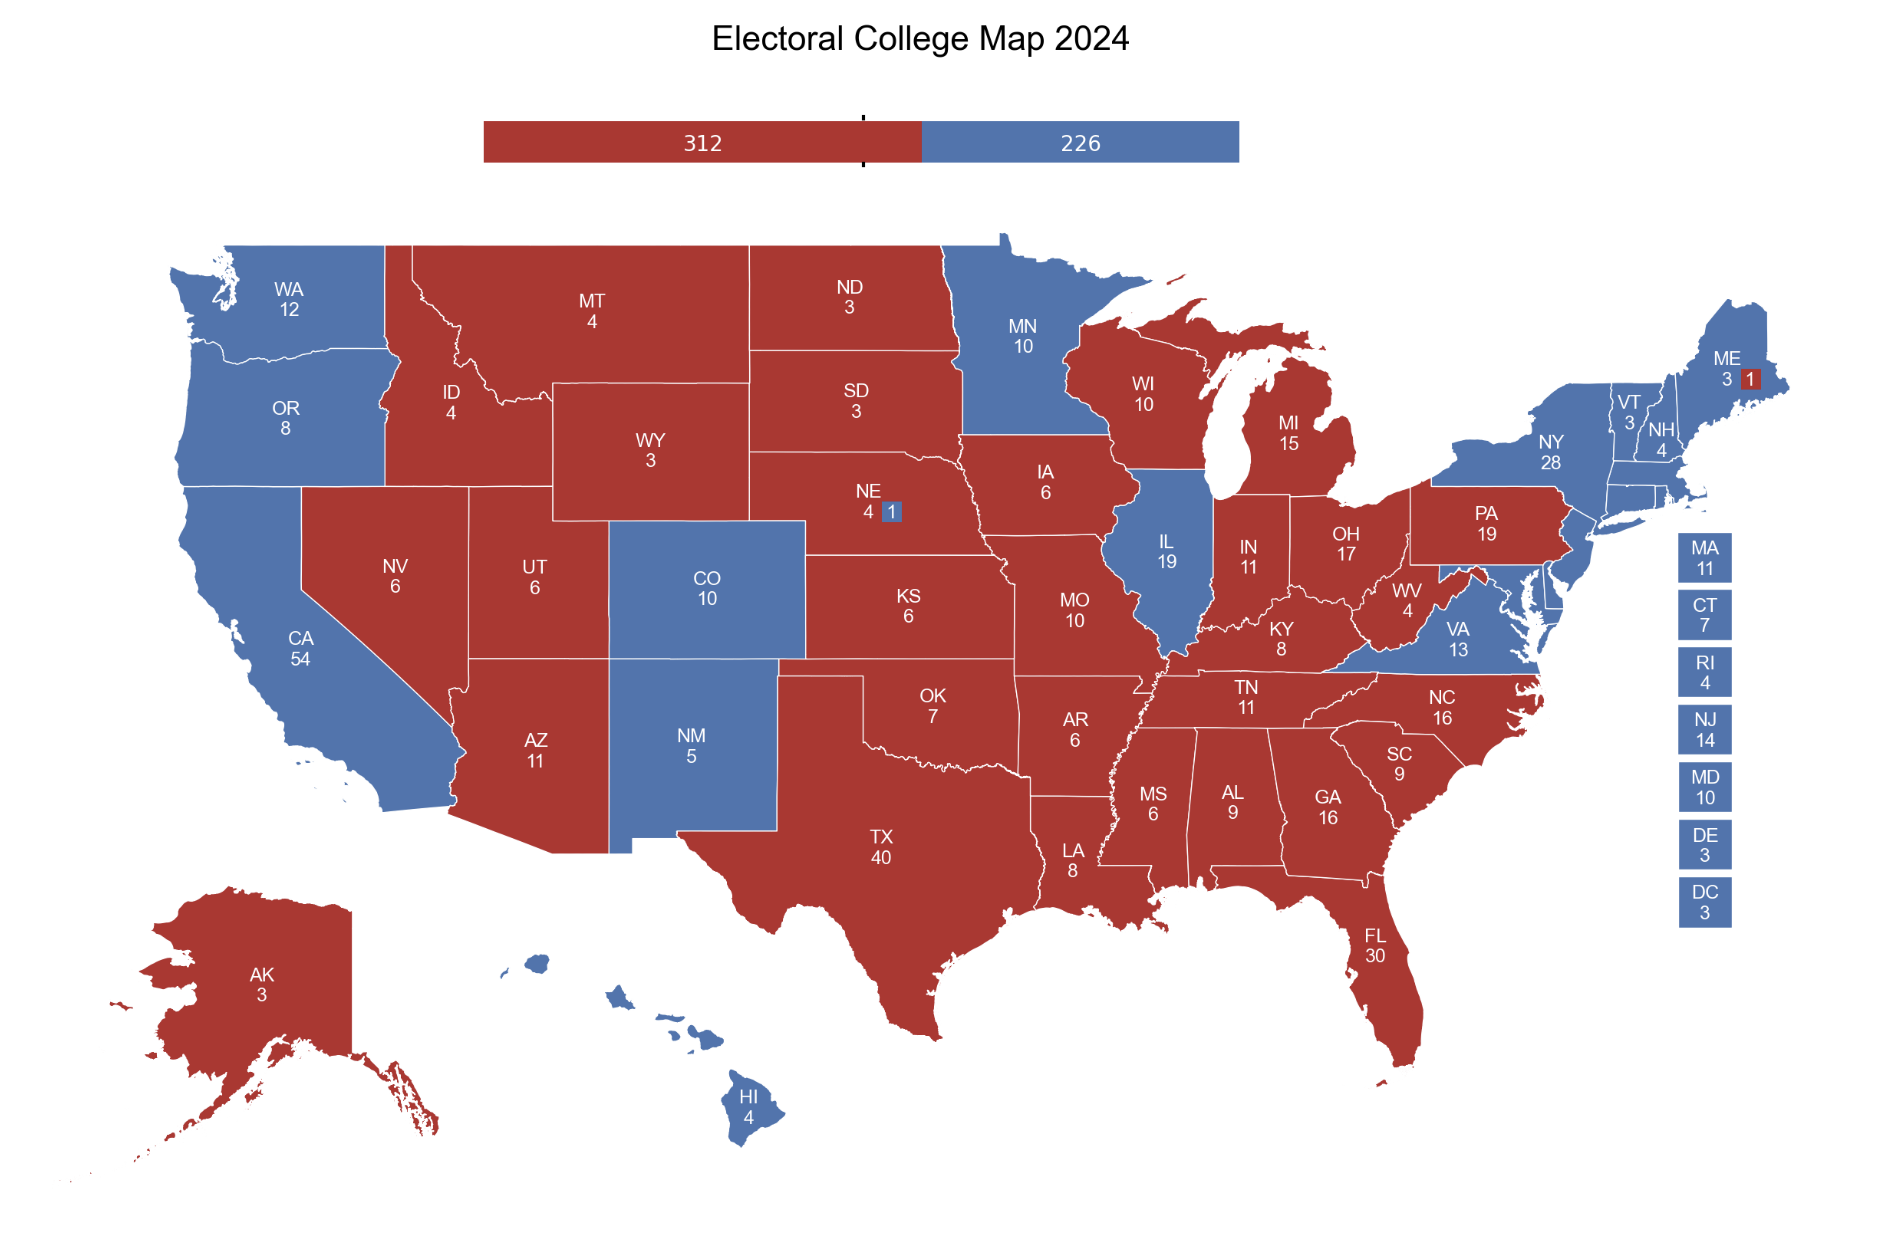
The Present: Plotting Current and Future United States Elections
PoliSciPy excels at plotting U.S. elections, both current and hypothetical. It can create state-of-the-art Electoral College visualizations that support any number of candidates, making it ideal for exploring hypothetical matchups or analyzing candidate performance. The vote bar at the top provides a clear visual summary of candidate standings and can help illustrate different win conditions based on the distribution of votes.
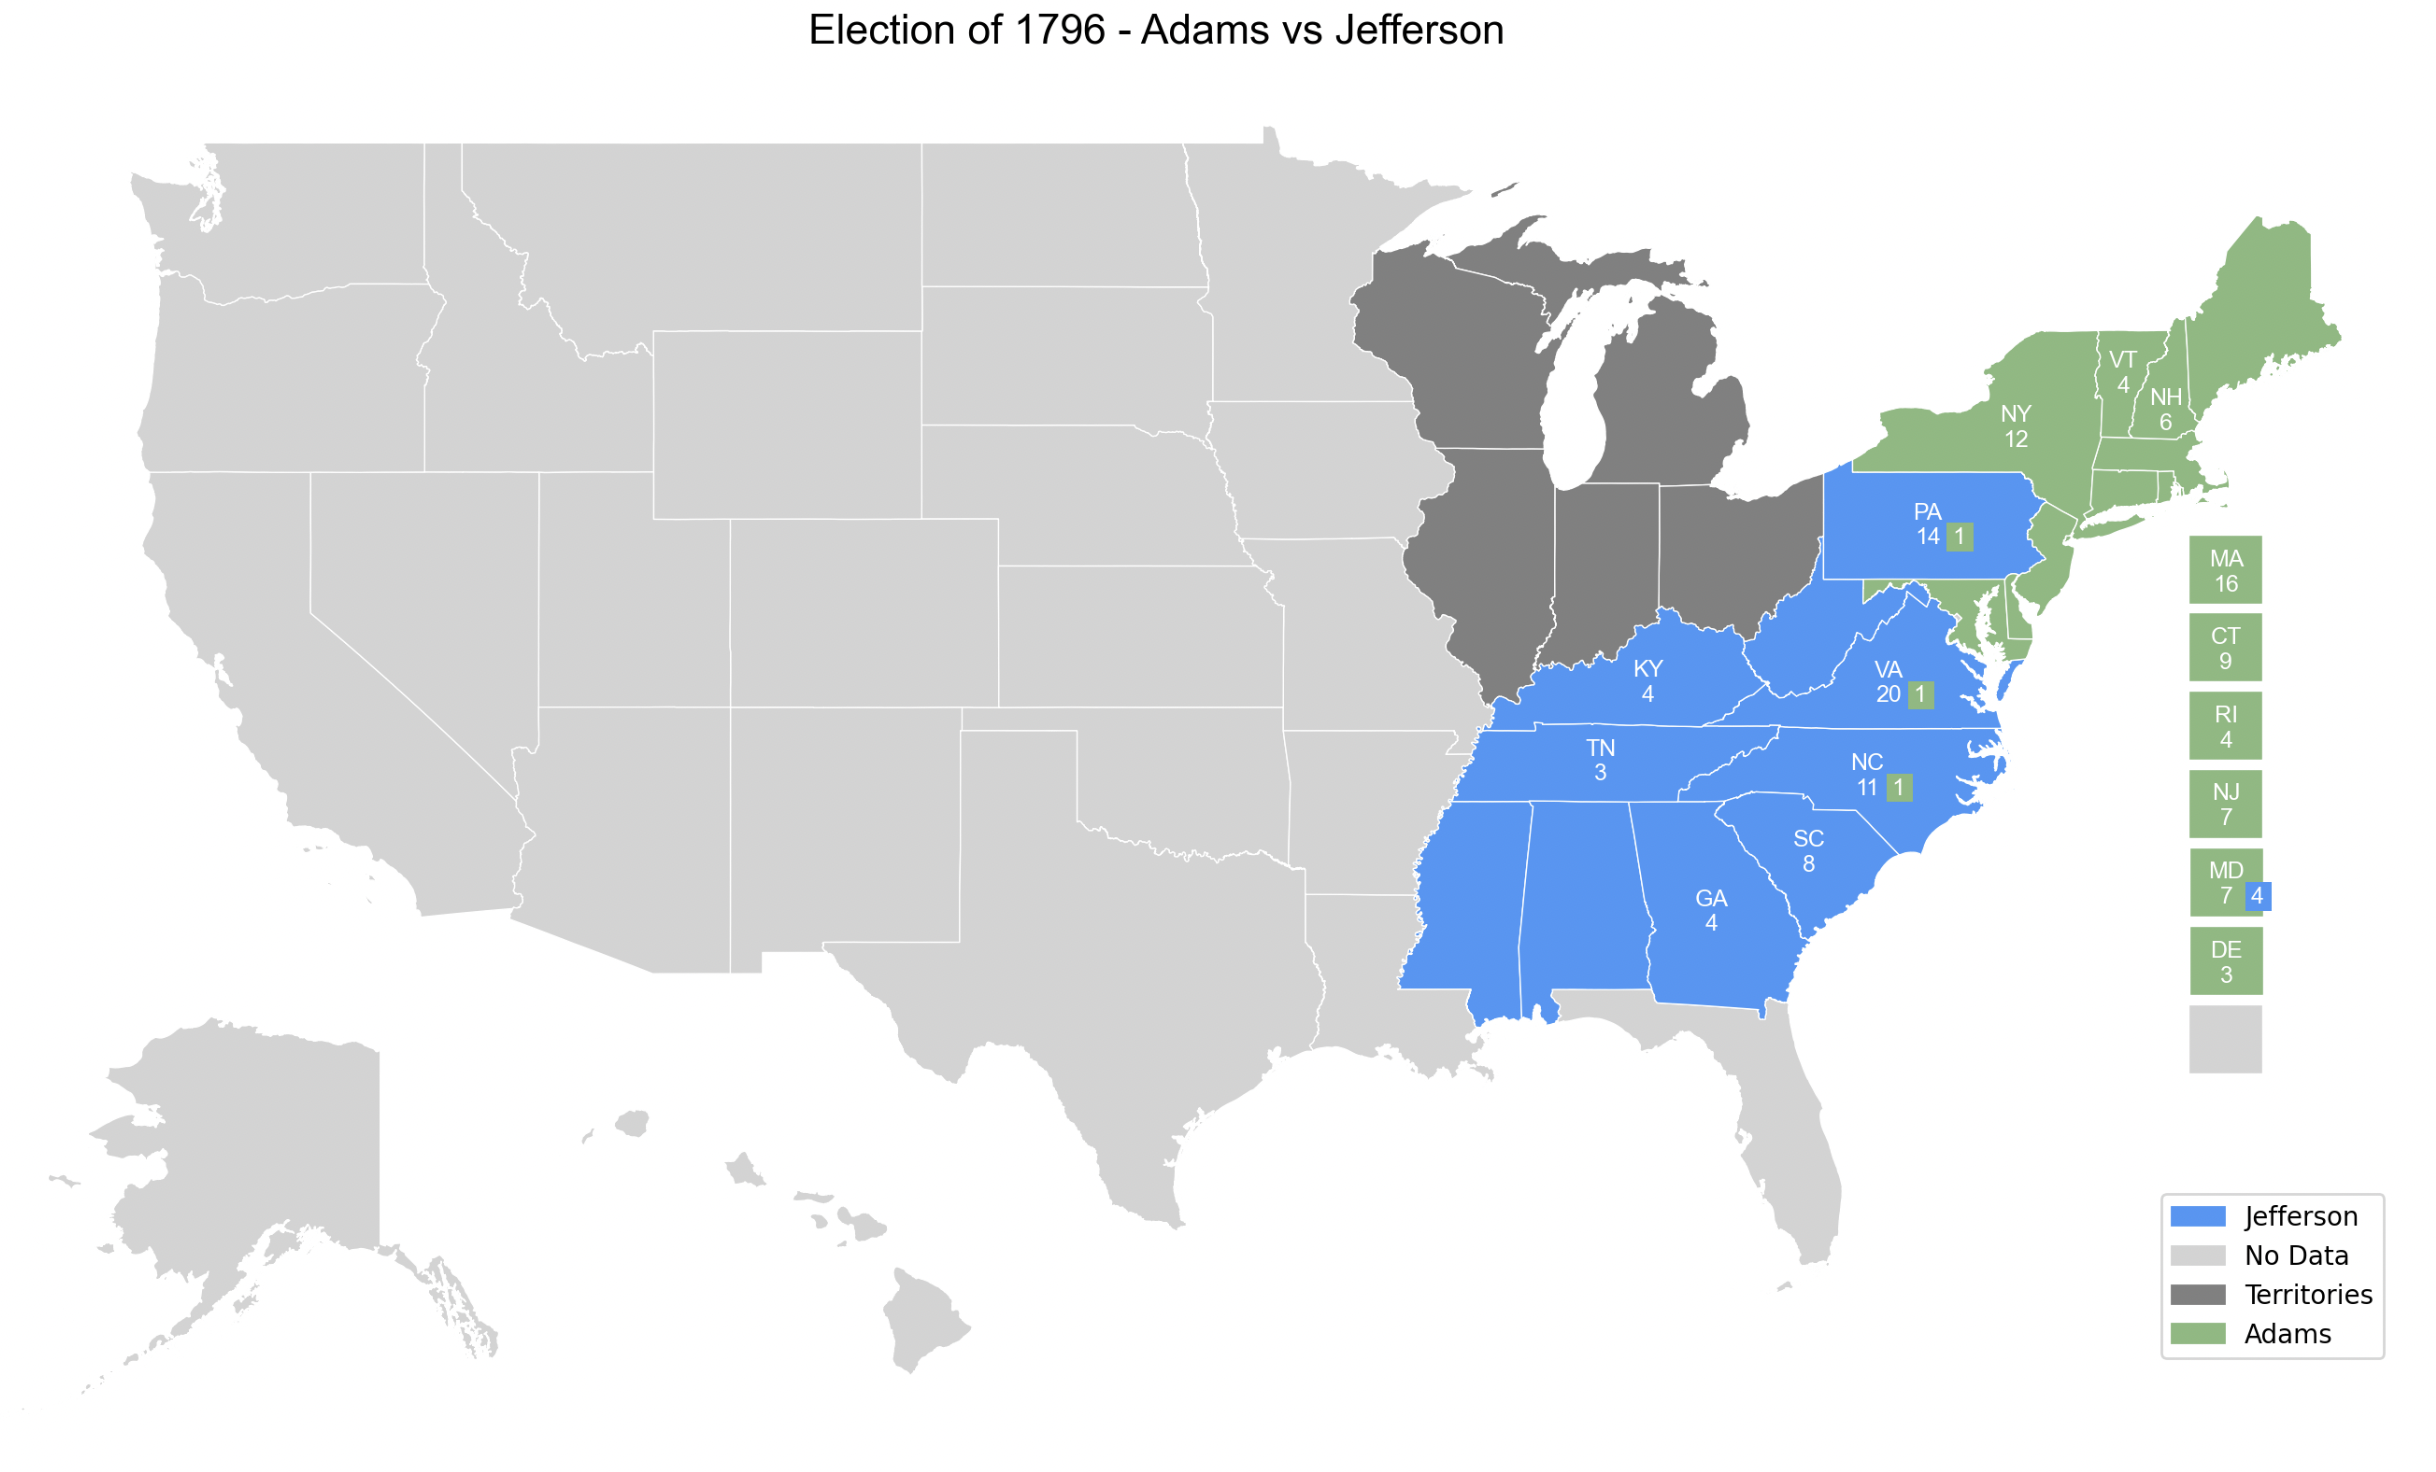
Early Post-Colonial History: Plotting Early United States Elections
After gaining independence, some of the United States’ earliest elections featured maps that looked very different from those of today. These elections included far fewer states, primarily representing the original thirteen colonies, along with some newly acquired territories. PoliSciPy allows users to visualize these territories and merged state regions—for example, Massachusetts once included what is now Maine, and Georgia encompassed present-day Mississippi and Alabama—by incorporating their historical data and colormaps.
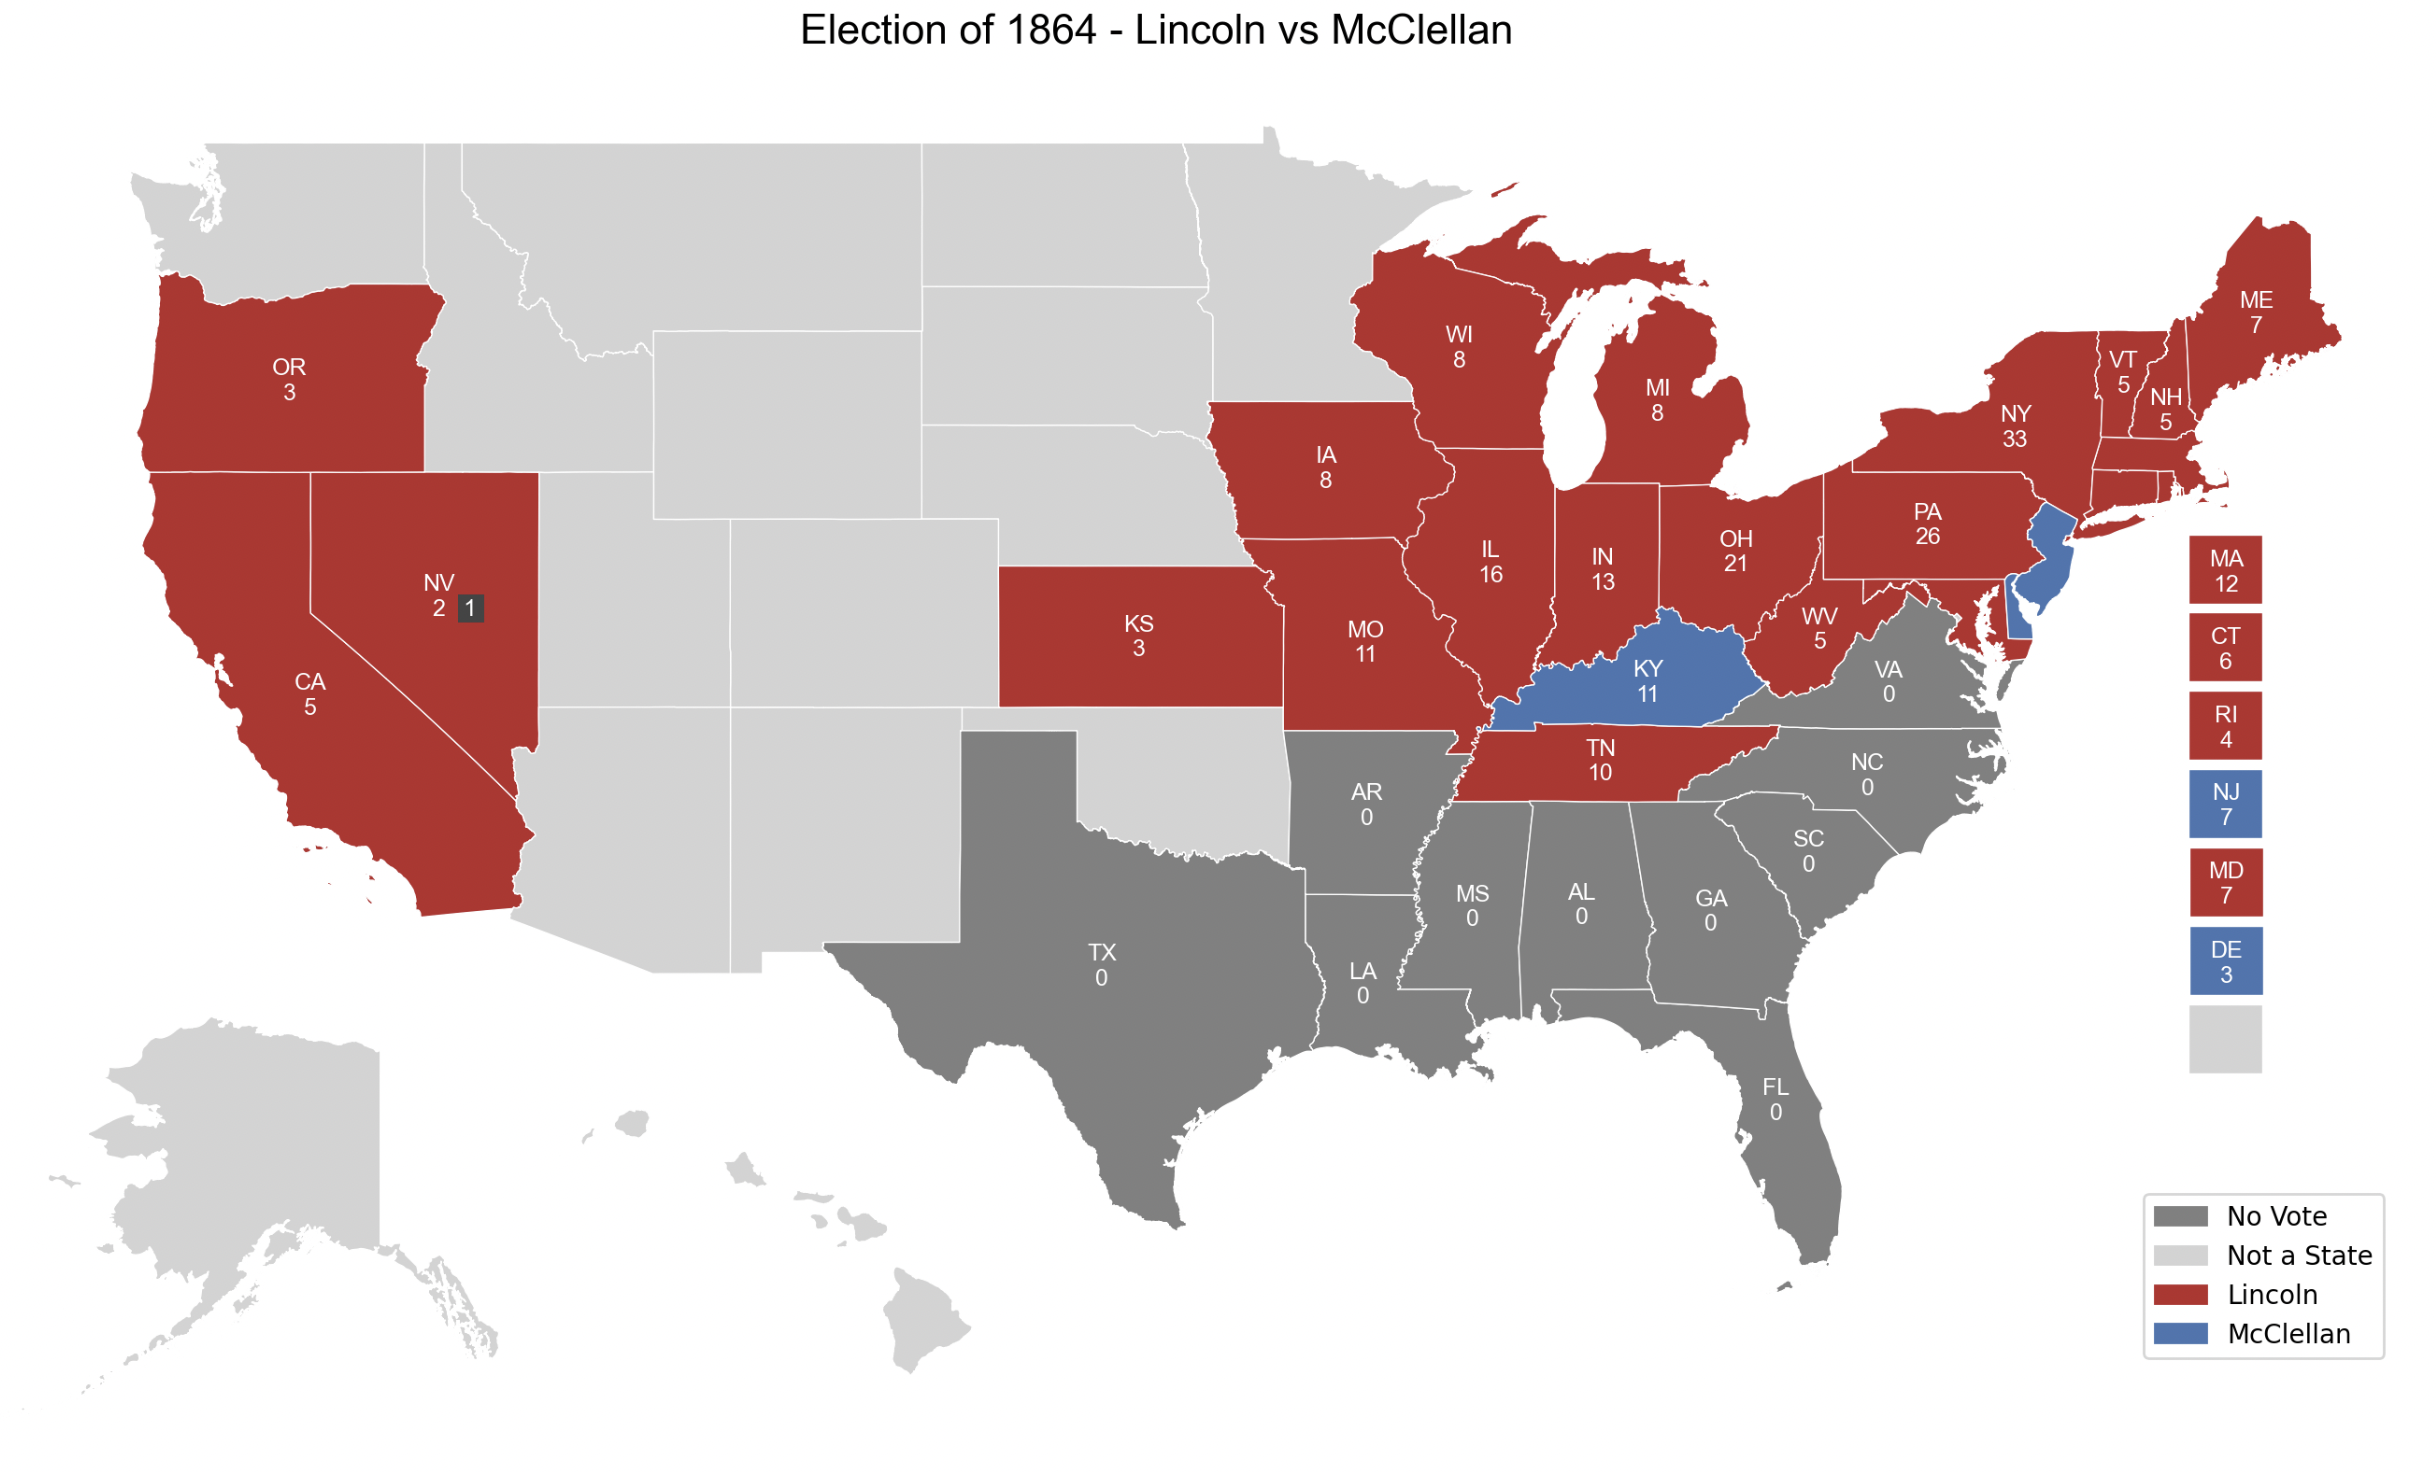
The Civil War and Reconstruction: Plotting More Complex Maps
PoliSciPy also allows you to plot more complex historical Electoral College maps that include states which did not participate in certain elections. During the Civil War, several Southern states seceded from the Union and did not participate in the 1864 election. In the Reconstruction period that followed, some Southern states remained ineligible to cast electoral votes for several years. The consequences of these exclusions are illustrated below in the results of the 1864 election.