Customization
PoliSciPy allows you to customize various aspects of your electoral college maps, from the colormap to map labels and titles. Customizing your map can help make your visualizations more informative and visually appealing.
Colormaps
Colormaps define the colors used for each political party or candidate.
Default Colormap
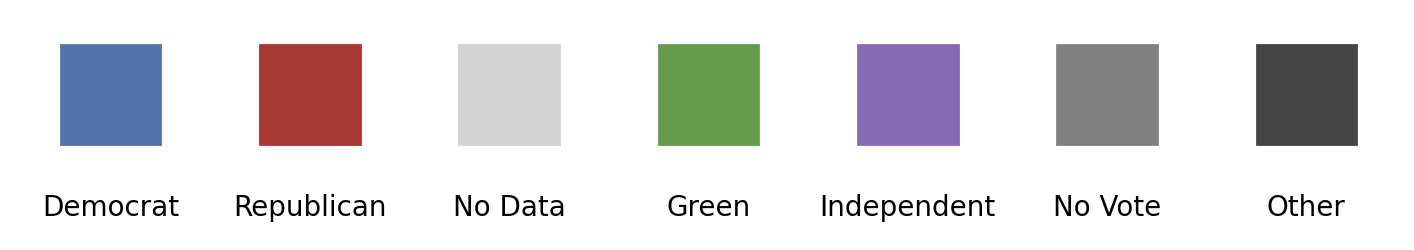
PoliSciPy provides a default colormap:
default_party_colors = {
    'Democrat': '#4875b1',
    'Republican': '#b82b2b',
    'No Data': 'lightgray',
    'Green': '#519e3e',
    'Independent': '#8d69b8',
    'No Vote': 'gray'
}
In addition, defecting voters who do not belong to a specific party are represented by #444444 (dark gray) by default.
Below is a visualization of the full default colormap:
Creating custom colormaps
Users can create custom colormaps to better suit their specific needs. To define a custom colormap, simply create a dictionary similar to the default_party_colors example above, specifying the desired color for each party or candidate.
Here is an example of a custom colormap:
custom_party_colors = {
    'Democrat': '#1f77b4',  # Blue for Democrats
    'Republican': '#ff7f0e',  # Orange for Republicans
    'Independent': '#2ca02c',  # Green for Independents
    'No Data': 'grey',  # Grey for missing data
    'Green': '#9467bd',  # Purple for Green Party
    'Sam Smith': 'cyan' # Add another party/candidate
}
To apply your custom colormap in PoliSciPy, pass it as a parameter to the relevant plotting function, such as plot_electoral_map():
plot_electoral_map(
    gdf,
    column='winning_party',
    party_colors=custom_party_colors
)
This flexibility allows you to tailor the visual representation of maps to match your project’s requirements or preferences.
When working with colormaps you might encounter the error:
The following party(ies) found in data, but not defined in colormap: Party1, Party2While PoliSciPy does not impose a limit on how many different party colors you can define, you must have at least one color defined for every party that you plan on visualizing in your electoral college map. If you have a winning political party defined in your data that does not have a corresponding color in your colormap, you will encounter this error.
Map Customization
PoliSciPy also offers several ways to customize other aspects of your electoral college maps, including map titles, labels, and legends. Here are a few options for customizing the appearance of your map.
Map Titles and Labels
You can customize the title of your map using the title parameter:
# Plot electoral college map with a custom title and labels
plot_electoral_map(
    gdf,
    party_colors=custom_party_colors,
    title="2024 U.S. Electoral College Map",
)
State labels (postal code and electoral votes) are automatically added, and you can adjust their color and font size using labelcolor and fontsize.
Legends
Legends help users understand the colors representing each party or candidate.
- Enable a legend using
legend=True. - Customize legend order with
legend_order:
custom_legend_order = ['Democrat', 'Republican', 'Green', 'Independent', 'No Data']

plot_electoral_map(
    gdf,
    column='winning_party',
    party_colors=custom_party_colors,
    legend=True,
    legend_order=custom_legend_order
)
This ensures that parties appear in the legend in the order you specify, instead of the default order derived from the data.
State Border Customization
You can adjust the appearance of state boundaries (e.g. width or color):
plot_electoral_map(
    gdf,
    column='winning_party',
    party_colors=custom_party_colors,
    edgecolor='black',  # Color of state borders
    linewidth=1.0       # Width of state borders
)
Other Styling Options
Additional keyword arguments (**kwargs) are passed to GeoDataFrame.plot(). Examples include:
In addition to the features above, PoliSciPy allows other styling options such as:
alpha– transparency of the filled regions.facecolor– override the fill color.zorder– control plotting order of layers.
You can combine these to fully customize your map’s visual style.