Plotting Civil War and Reconstruction Electoral College Maps with PoliSciPy
During the Civil War and post-Reconstruction era, the political landscape of the United States underwent significant shifts. Several Southern states were excluded from participating in presidential elections entirely, particularly in the elections of 1864, 1868, and 1872. Using PoliSciPy, we can visualize these historical electoral maps, capturing the impact of Secession and Reconstruction policies on the Electoral College.
Understanding Post-Reconstruction Elections
Following the Civil War, the Reconstruction period (1865–1877) saw federal efforts to reintegrate the Southern states into the Union. However, during the presidential elections of 1868 and 1872, some former Confederate states did not participate fully in the Electoral College.
Key aspects of post-Reconstruction elections:
- 1868 Election: Texas, Virginia, and Mississippi did not participate, as their Reconstruction governments were not yet recognized.
- 1872 Election: Most states were readmitted, but disputes in Louisiana and Arkansas led to their votes being rejected. Visualizing these elections requires accurately representing the electoral landscape at this time.
Step 1: Install PoliSciPy
Ensure you have PoliSciPy installed to access historical shapefiles and election visualization tools.
pip install poliscipy
For more installation details, refer to the Installation page.
Step 2: Import Necessary Libraries
Once you have PoliSciPy installed, begin by importing it and its relevant methods:
import poliscipy

from poliscipy.shapefile_utils import load_shapefile
from poliscipy.plot import plot_electoral_map
Step 3: Load Historical Shapefiles
For post-Reconstruction elections, we must use the correct state boundaries for the given year. PoliSciPy provides shapefiles reflecting the political landscape at various historical moments.
gdf = load_shapefile(year="1864")
This function loads a GeoDataFrame representing U.S. state boundaries as they were in 1864.
Step 4: Prepare Election Data
We’ll create a dictionary representing the 1864 U.S. presidential election results. Since Texas, Virginia, and Mississippi did not participate, we will mark these states accordingly.
winning_party_1864 = {
    'AL': 'No Vote','AR': 'No Vote','CA': 'Lincoln','CT': 'Lincoln', 'DE': 'McClellan', 'FL': 'No Vote',
    'GA': 'No Vote', 'IL': 'Lincoln','IN': 'Lincoln','IA': 'Lincoln', 'KS': 'Lincoln','KY': 'McClellan',
    'LA': 'No Vote','ME': 'Lincoln','MD': 'Lincoln','MA': 'Lincoln','MI': 'Lincoln', 'MS': 'No Vote',
    'MO': 'Lincoln','NV': 'Lincoln','NH': 'Lincoln','NJ': 'McClellan','NY': 'Lincoln','NC': 'No Vote',
    'OH': 'Lincoln','OR': 'Lincoln','PA': 'Lincoln','RI': 'Lincoln','SC': 'No Vote','TN': 'Lincoln',
    'TX': 'No Vote','VT': 'Lincoln','VA': 'No Vote','WV': 'Lincoln',
    'WI': 'Lincoln'
}
Note:
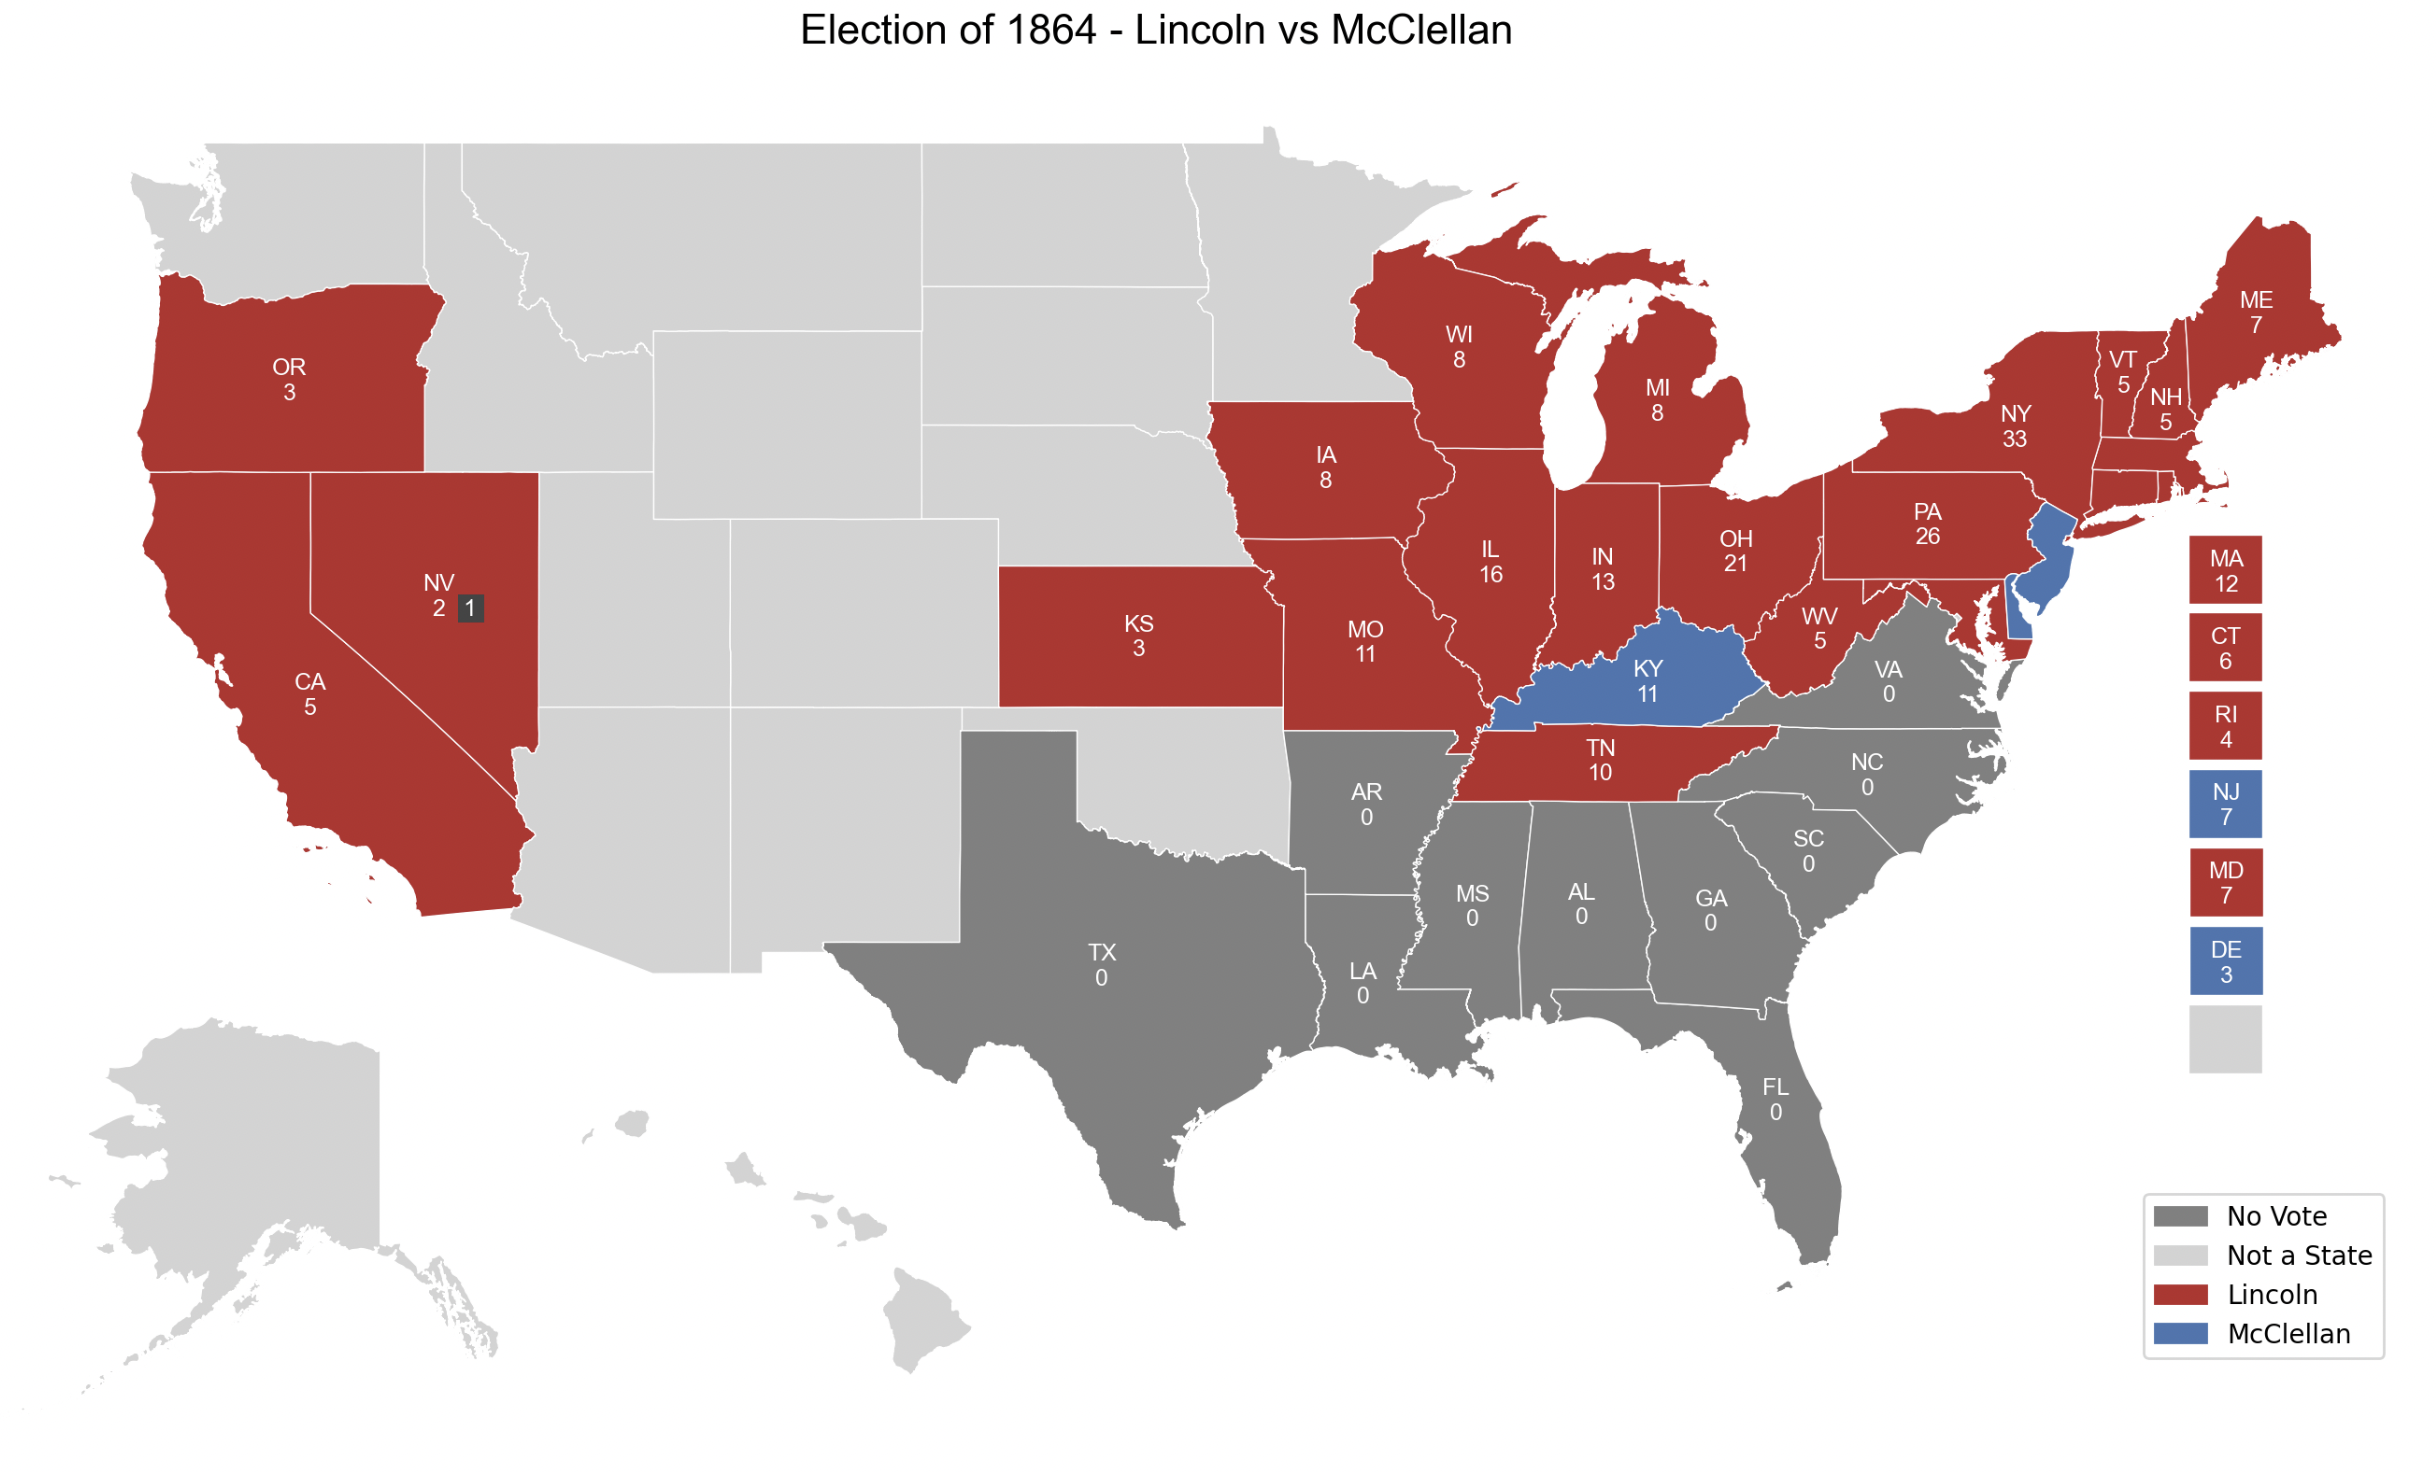
- Several Southern states—including Texas, Virginia, Mississippi, Georgia, South Carolina, Florida, and North Carolina—did not participate in the 1864 election, so they are labeled as “No Vote”.
- The National Union Party candidate, Abraham Lincoln, won the election against the Democratic candidate, George B. McClellan.
Step 5: Merge Election Data with Shapefile
To map the election results, we merge the DataFrame with the GeoDataFrame:
# Merge the election data with the GeoDataFrame
gdf = gdf.merge(df, left_on='NAME', right_on='state', how='left')
This ensures that each state is assigned the correct election outcome.
Step 6: Add the defecting voters to represent the split states
Adding the defecting voters to represent split states:
# add the number of defecting voters for each respective state
gdf.loc[27, 'defectors'] = 1 # Nevada snowbound elector

# add the defecting party for each of the defecting voters
gdf.loc[3, 'defector_party'] = 'Other'
Step 7: Plot the Electoral College Map
plot_electoral_map(gdf, column='winning_party', legend=True, party_colors=custom_colors_1864,
                   title="Election of 1864 - Lincoln vs McCellan")
This function generates a map highlighting which states voted for each candidate and which states did not participate.
Example Output
Here’s an example of the 1864 U.S. Presidential Election map: