Visualizing U.S. Elections: Current and Future Elections with PoliSciPy
In this example, we’ll explore how to visualize current and upcoming U.S. elections using PoliSciPy. By leveraging historical shapefiles and election results data, you can plot electoral maps that showcase political landscapes for various election years, including future elections.
Understanding U.S. Elections
The United States holds presidential elections every four years, where each state participates in the Electoral College system to determine the winner. The political landscape and voting patterns evolve over time, which is why visualizing these elections helps us understand the trends and shifts in political power.
Step 1: Install PoliSciPy
To get started, you’ll need to install PoliSciPy, a Python package designed for electoral data visualization and analysis. You can install it via pip:
pip install poliscipy
For more installation details, refer to the PoliSciPy Installation Guide.
Step 2: Import Necessary Libraries
Once you have PoliSciPy installed, begin by importing it and its relevant methods:
import poliscipy

from poliscipy.shapefile_utils import load_shapefile
from poliscipy.plot import plot_electoral_map
This will allow you to work with the election data and generate maps using the available shapefiles.
Step 3: Load Historical Shapefiles
PoliSciPy provides shapefiles for various historical election years. For the current and upcoming elections, you can load the shapefile for the most recent election year. For example, for the 2024 presidential election:
gdf = load_shapefile()
This function loads a GeoDataFrame containing the geometries and attributes of states as they existed in 2024, based on the latest available data.
Step 4: Prepare Election Data
Next, prepare the election results for the chosen year. For example, for the 2024 U.S. presidential election, create a dictionary with the election results:
winning_party = {
    'AL': 'Republican','AK': 'Republican','AZ': 'Republican','AR': 'Republican','CA': 'Democrat','CO': 'Democrat',
    'CT': 'Democrat', 'DE': 'Democrat', 'FL': 'Republican', 'GA': 'Republican', 'HI': 'Democrat',
    'ID': 'Republican', 'IL': 'Democrat','IN': 'Republican','IA': 'Republican','KS': 'Republican',
    'KY': 'Republican', 'LA': 'Republican','ME': 'Democrat','MD': 'Democrat','MA': 'Democrat',
    'MI': 'Republican','MN': 'Democrat','MS': 'Republican','MO': 'Republican','MT': 'Republican','NE': 'Republican',
    'NV': 'Republican','NH': 'Democrat','NJ': 'Democrat','NM': 'Democrat','NY': 'Democrat','NC': 'Republican',
    'ND': 'Republican','OH': 'Republican','OK': 'Republican','OR': 'Democrat','PA': 'Republican','RI': 'Democrat',
    'SC': 'Republican','SD': 'Republican','TN': 'Republican','TX': 'Republican','UT': 'Republican','VT': 'Democrat',
    'VA': 'Democrat','WA': 'Democrat','WV': 'Republican','WI': 'Republican','WY': 'Republican', 'DC': 'Democrat'
}
This dictionary includes the states that participated in the 2024 election and the respective party that won in each state.
Step 5: Merge Election Data with Shapefile
To visualize the election results, you’ll need to merge your election data with the shapefile’s GeoDataFrame. This ensures that the geographical boundaries of each state are matched with the corresponding election results.
# add the winning party and fill any missing data with 'No Data'
gdf['winning_party'] = gdf['STUSPS'].map(winning_party).fillna('Not a State')
Step 6: Add the Non-Winner-Takes-All States (Maine and Nebraska)
# add the number of electors that voted for the other candidate
gdf.loc[38, 'defectors'] = 1 # maine
gdf.loc[10, 'defectors'] = 1 # nebraska

# set the political party for each of the congressional district winners
gdf.loc[38, 'defector_party'] = 'Republican'
gdf.loc[10, 'defector_party'] = 'Democrat'
Step 7: Plot the Electoral Map
Now that you’ve merged the data, you can visualize the electoral results by plotting the map:
# Plot the 2024 electoral map
plot_electoral_map(gdf, column='winning_party', title='2024 U.S. Presidential Election')
This function generates a map of the 2024 election results, coloring each state based on the winner. States that did not participate in the election can be marked as “No Votes”.
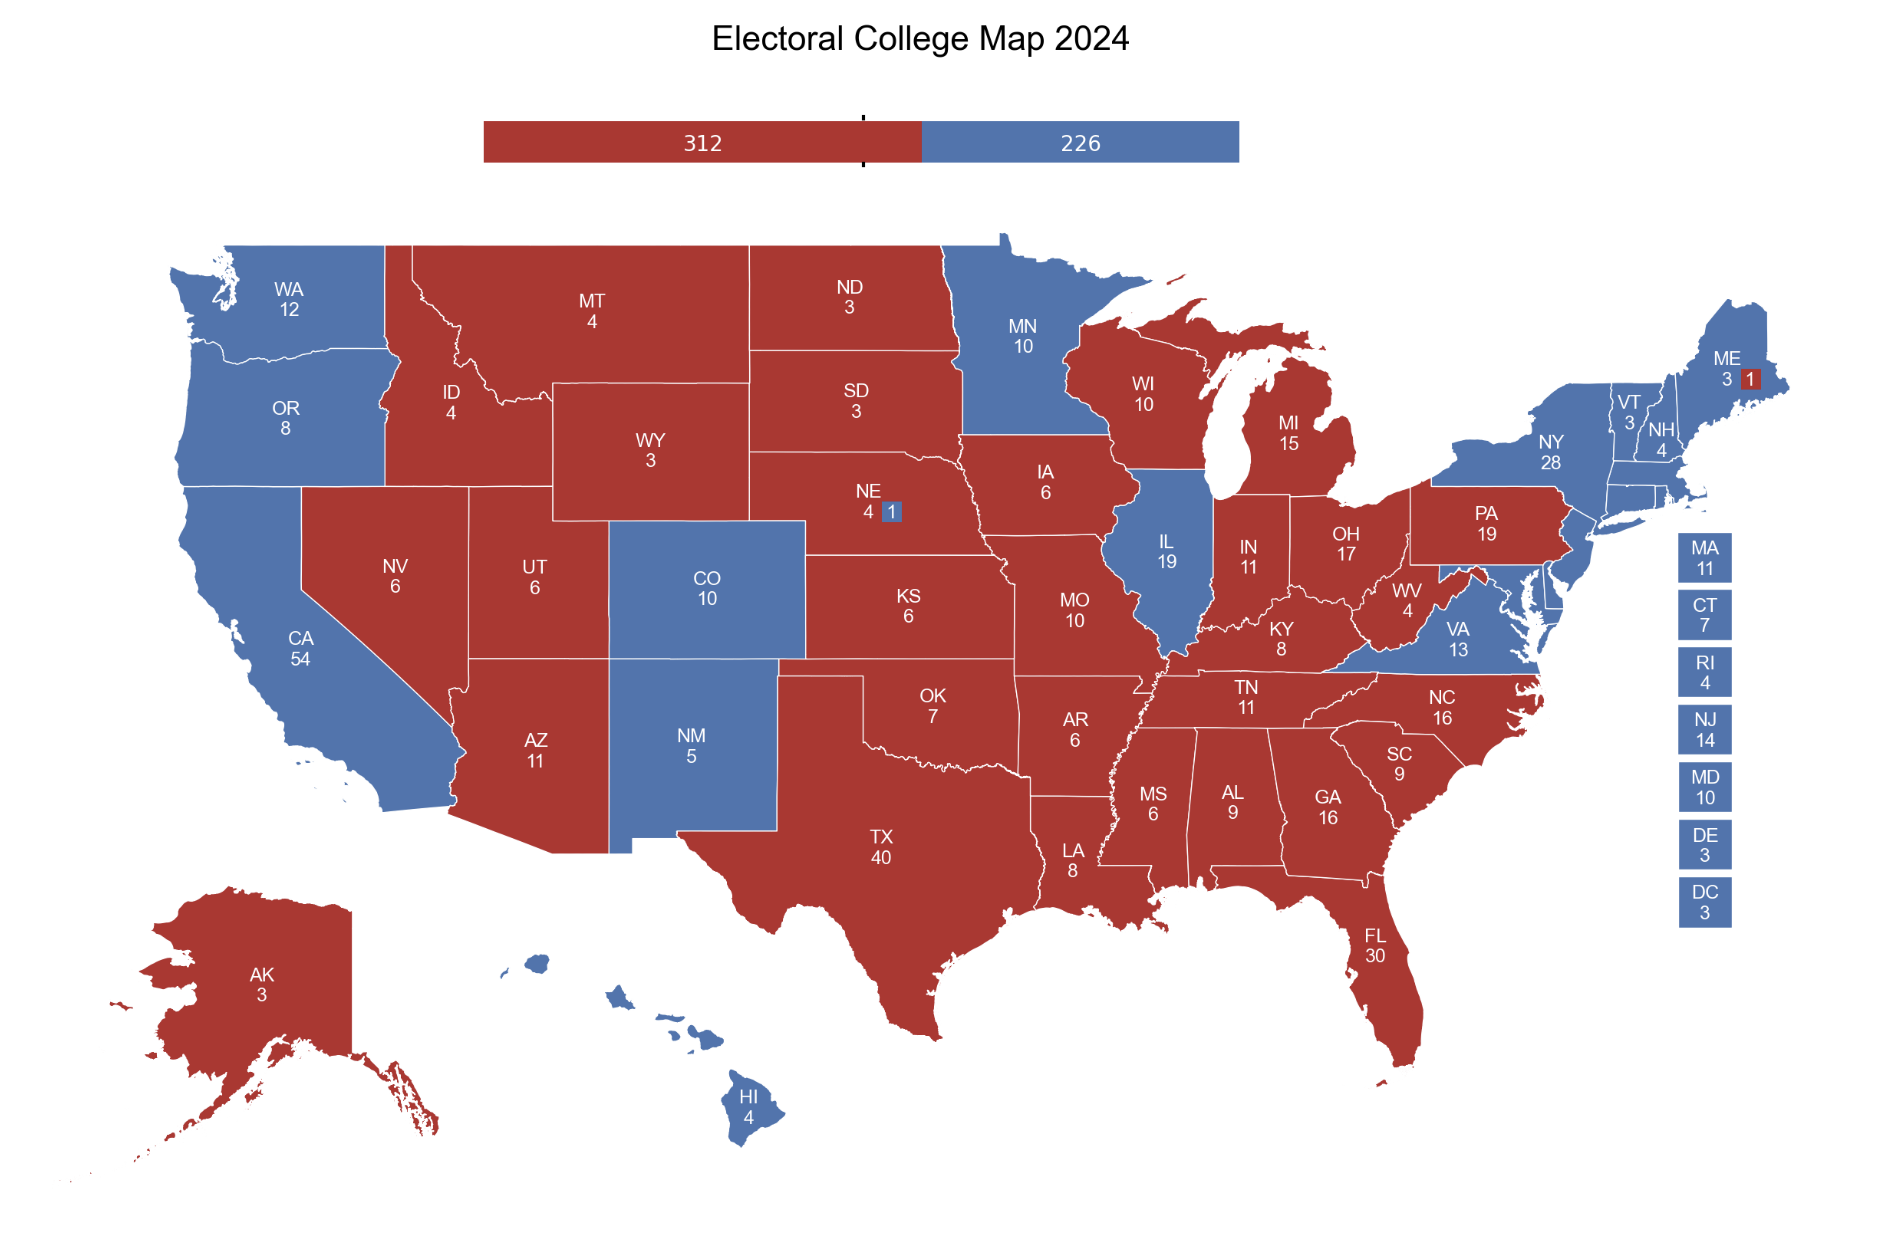
Example Output
Here’s what the 2024 U.S. Presidential Election map should look like after following the steps above: